Articles, charts, and other media from the DAT/Artathon

Written by Arogya on
The DAT/Artathon has involved a lot of resource sharing among all of us participants. Here’s a running list of interesting resources for you to go through:
- Corrinne shared this scientific color palette by Crameri et. al.
- Jackie shared a new book: Critical Disaster Studies. It’s announcing a new sub-discipline, and taking the view that disasters are a subjective sociopolitical construct.
- Sabine posted (kind of in response to Jackie Ratner) an article that talks about when to break the rules in dataviz
- Haley posted which dogs are overrated or underrated (this was also included in aysedemir’s presentation)
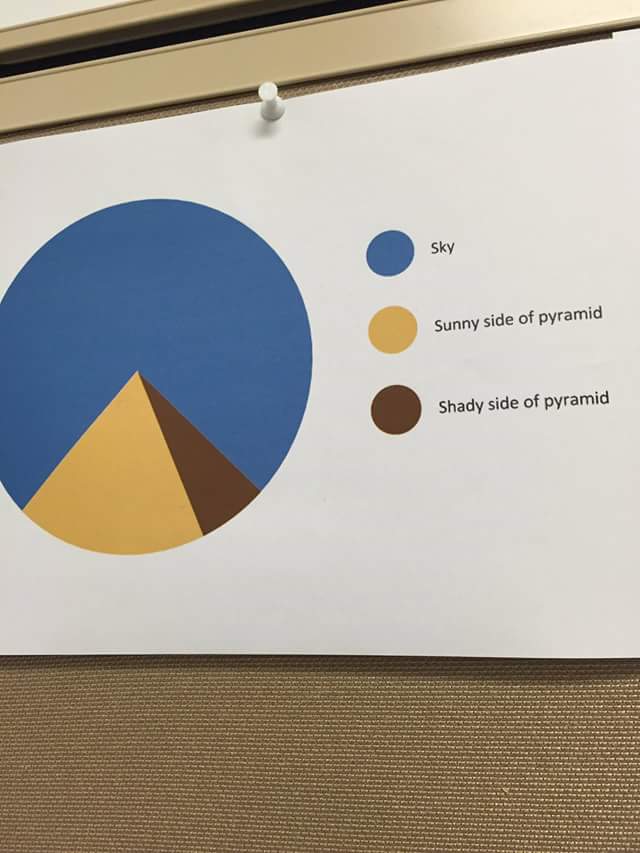
- Sabine posted a good pie chart (shown above)
- Shane posted an awareness test
- Arogya shared the Agile manifesto
- Charlotte shared some resources around aid localization (here and here)
- Jackie shared a guide on making maps that are clear
- Arogya shared a paper on narrative infoviz
- Jackie shared detailed guides on wrangling datasets and making charts. She also contributed a guide on news apps essentials
- Arogya wrote a guide for getting started with git
- Hannah shared tips on making disability friendly websites
- Shane stumbled on this article on smelling or listening to data
- Jackie shared https://rcrctoolbox.org, an online toolbox filled with “tools” for addressing children’s resilience in disasters
Comments