Communicating economic recovery with data stories (Kshitiz Khanal)

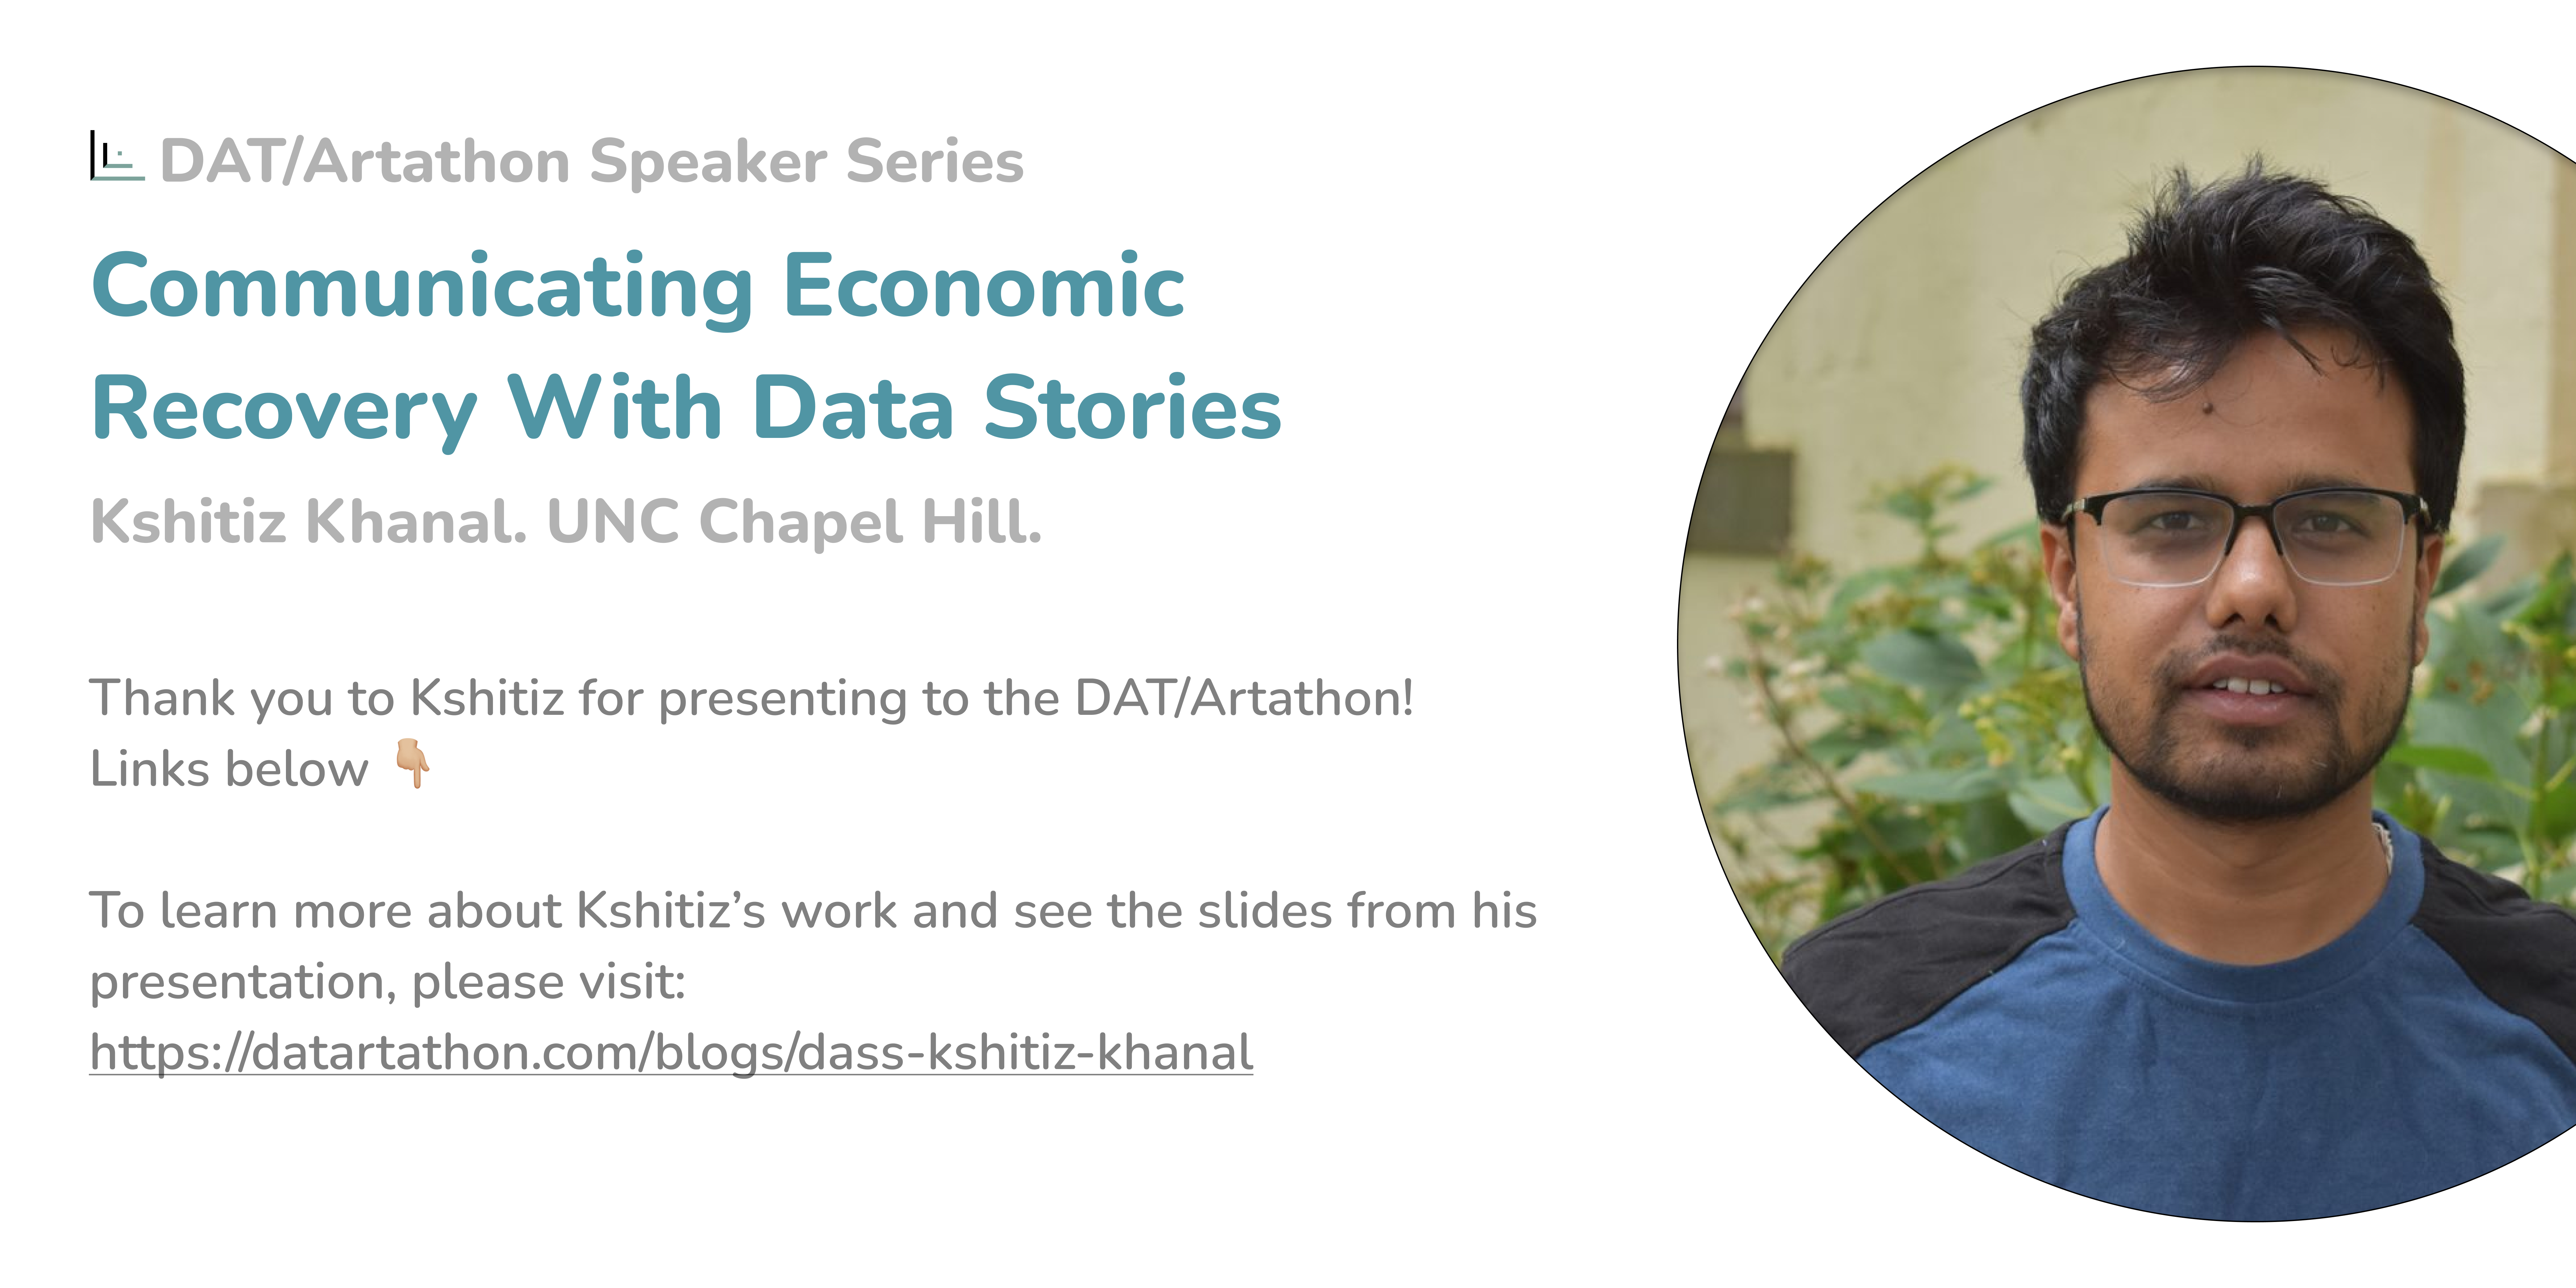
In November 2022, we had our third seminar of the DAT/Artathon Seminar Series. Kshitiz Khanal, PhD candidate at the Department of City and Regional Planning at the University of North Carolina at Chapel Hill, spoke on his experience both developing and teaching about data stories. He also shared plenty of resources, which you can find below.
About Kshitiz Khanal
Kshitiz Khanal (@kshitizkhanal7) is a PhD candidate at the Department of City and Regional Planning at the University of North Carolina at Chapel Hill. His research focuses on applications of machine learning and spatial analysis in energy planning. In his dissertation, he is investigating the utility of computer vision and natural language processing techniques to plan occupational transitions for clean energy jobs of the future. He was previously involved in open data and development research at Kathmandu Living Labs. He is a cofounder of Open Knowledge Nepal; a civic-tech open data advocacy nonprofit based in Nepal. To learn more about Kshitiz, please visit his website: https://kshitizkhanal.com/.
Communicating economic recovery with data stories
How can we track and communicate various facets of economic recovery after pandemic disasters like COVID-19? What can and can’t data dashboards communicate? How can we write data-driven stories for various audiences? And while we are at it, how can we write good data stories? In this talk, Kshitiz covered processes behind coming up with various indicators of economic recovery after the pandemic and communicating emergent stories to a variety of audiences using media including data stories and a data dashboard for the CarolinaTracker project https://carolinatracker.unc.edu/. He also shared his experiences teaching university students how to write data stories.
Resources from Kshitiz’s talk
- The slides from Kshitiz’s talk are available here.
- Kshitiz shared a list of useful resources on developing data stories in the following Google Doc: https://go.unc.edu/datastories .
- You can check out Kshitiz’s full presentation below!
About the DAT/Artathon Speaker Series
The DAT/Artathon speaker series will be held periodically throughout the year on the third Thursday of the month. Please check back on our EventBrite page to see upcoming speakers–we’ll feature a selection of speakers who are shaping data visualization regarding risk, resilience, natural hazards, or climate change.
Explore more like this
It's a wrap - concluding the first edition of the DAT/Artathon
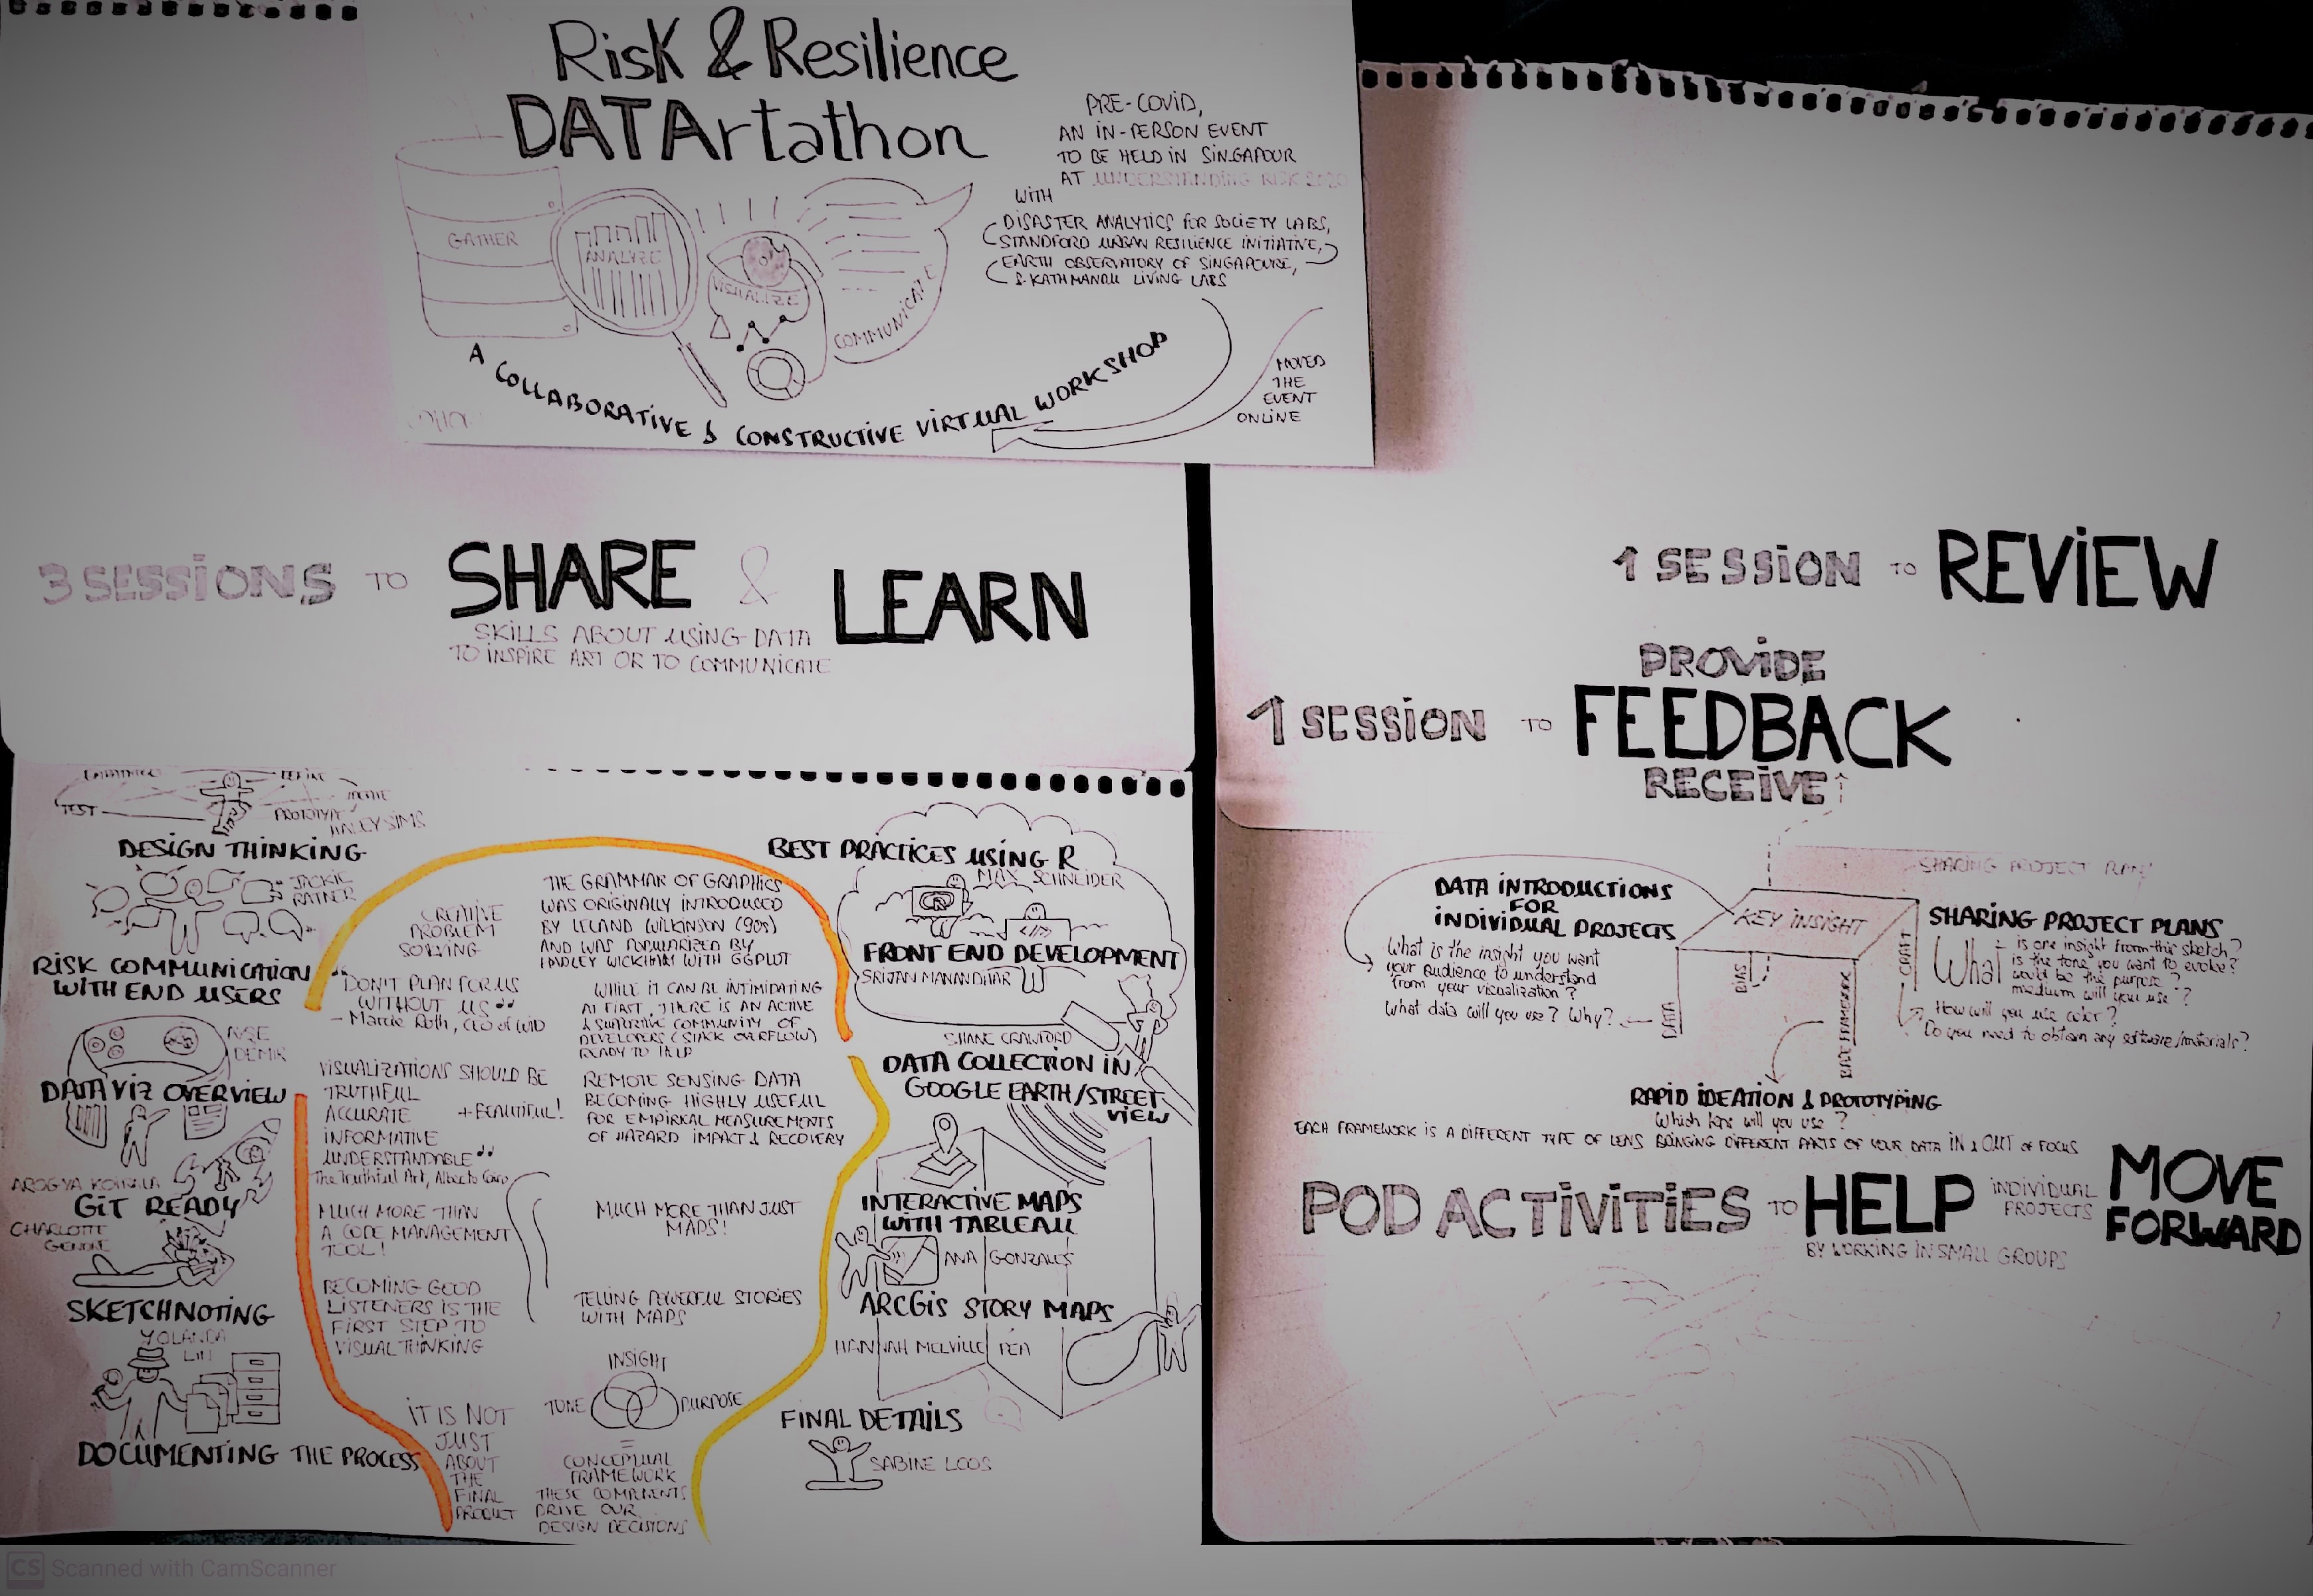
We are so thrilled to have hosted our inaugural Risk & Resilience DAT/Artathon from July 20 through August 7, 2020!...

Catch us at #UR2020
DAT/Artathon will be at UR2020 next week! Our session is titled DAT/Artathon: Turning risk data into visual art.

Why you should build your dataviz toolset early
A blogpost for early career professionals in risk and resilience, cross posted with Lloyd’s Register Foundation Institute for the Public...
Comments