Welcome to the DAT/Artathon gallery! Below are projects from our fellows. Click on one to learn more.
So you like scrolling? Why not learn while you do it
The DAT/Artathon workshop was THE perfect excuse to create my first storymap. Here’s the story of how I did it....
Beyond Disastrous Dataviz
This sketchnote is for enthusiastic newbies at dataviz who work not only with risk and resilience data but also more...
No, dinner is for everyone on the table!
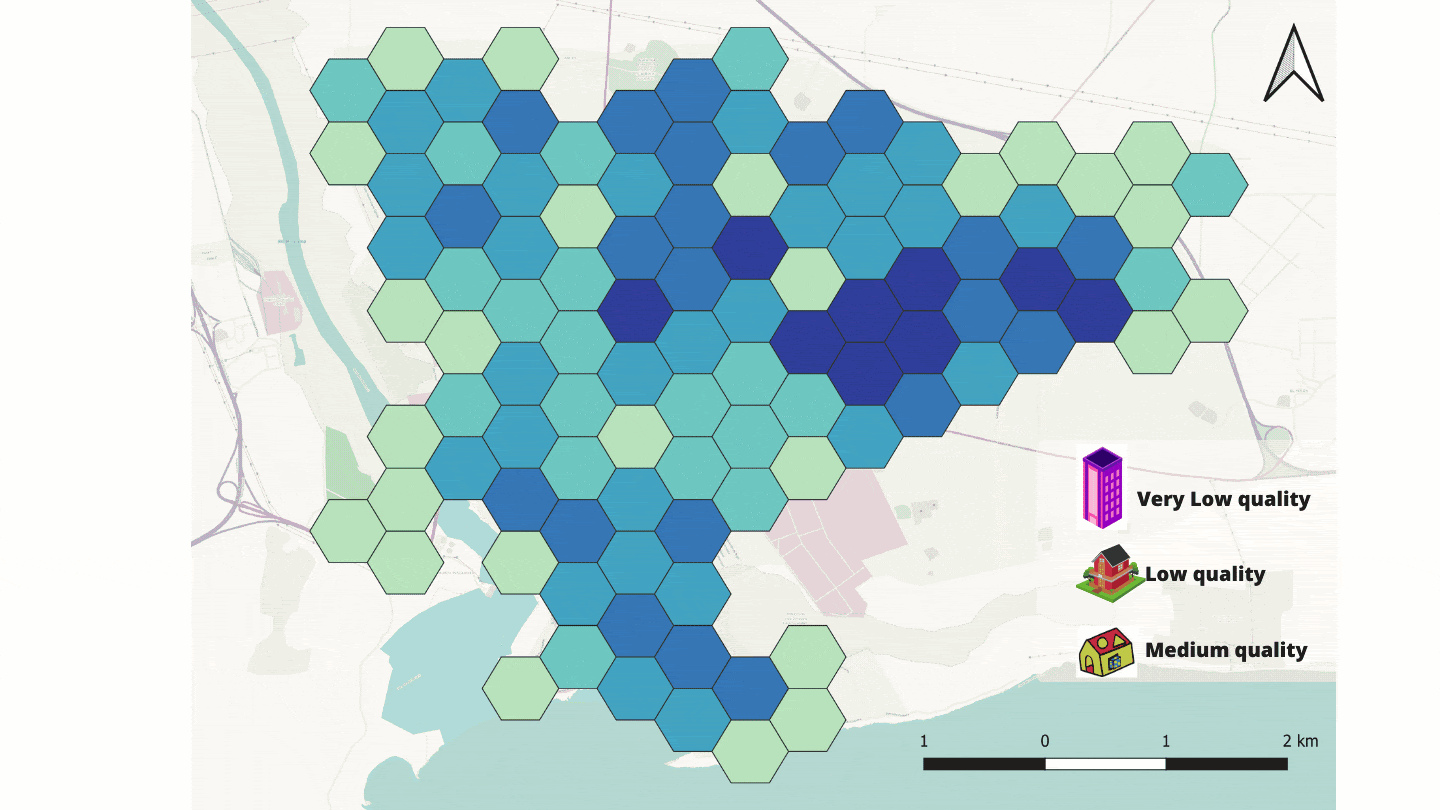
A wide range of actors contribute to OpenStreetMap (OSM) with varying backgrounds and skills. Inclusive visualisation of data quality in...
EcoRisk Forecasts - California
A data-driven story about California's uncertain climate future, indicating worrisome levels of temperature warming and precipitation decline.
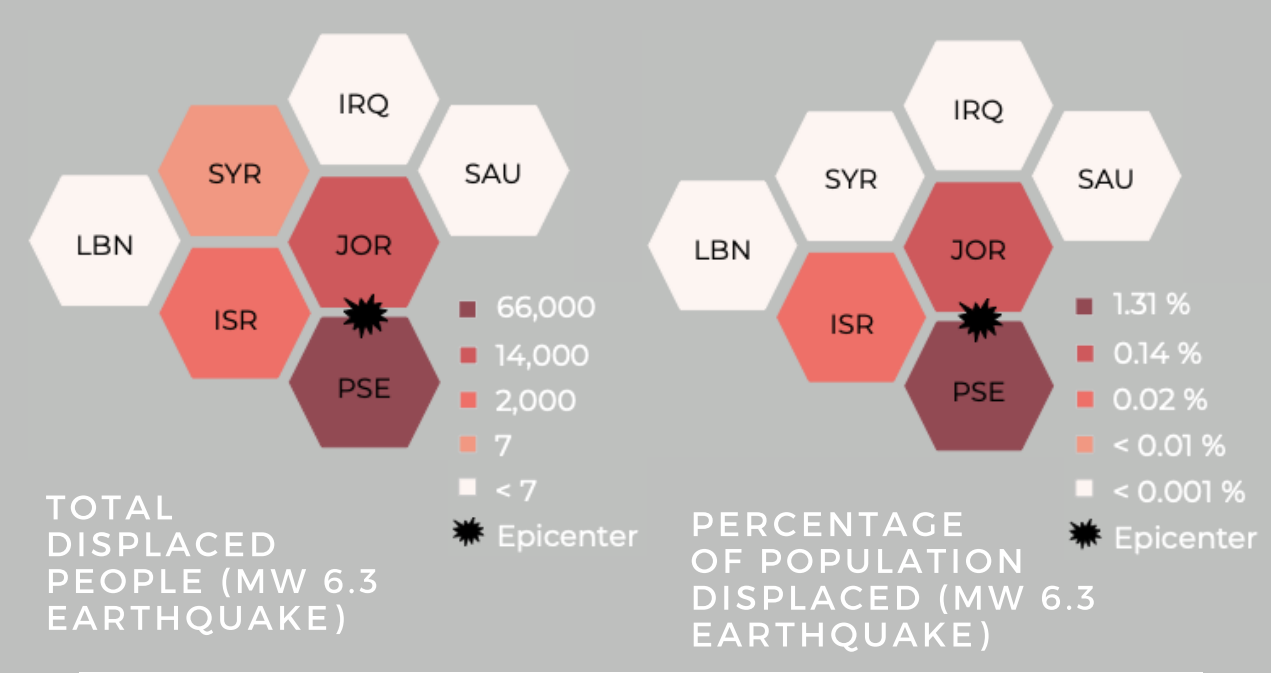
Displacement in the Levant
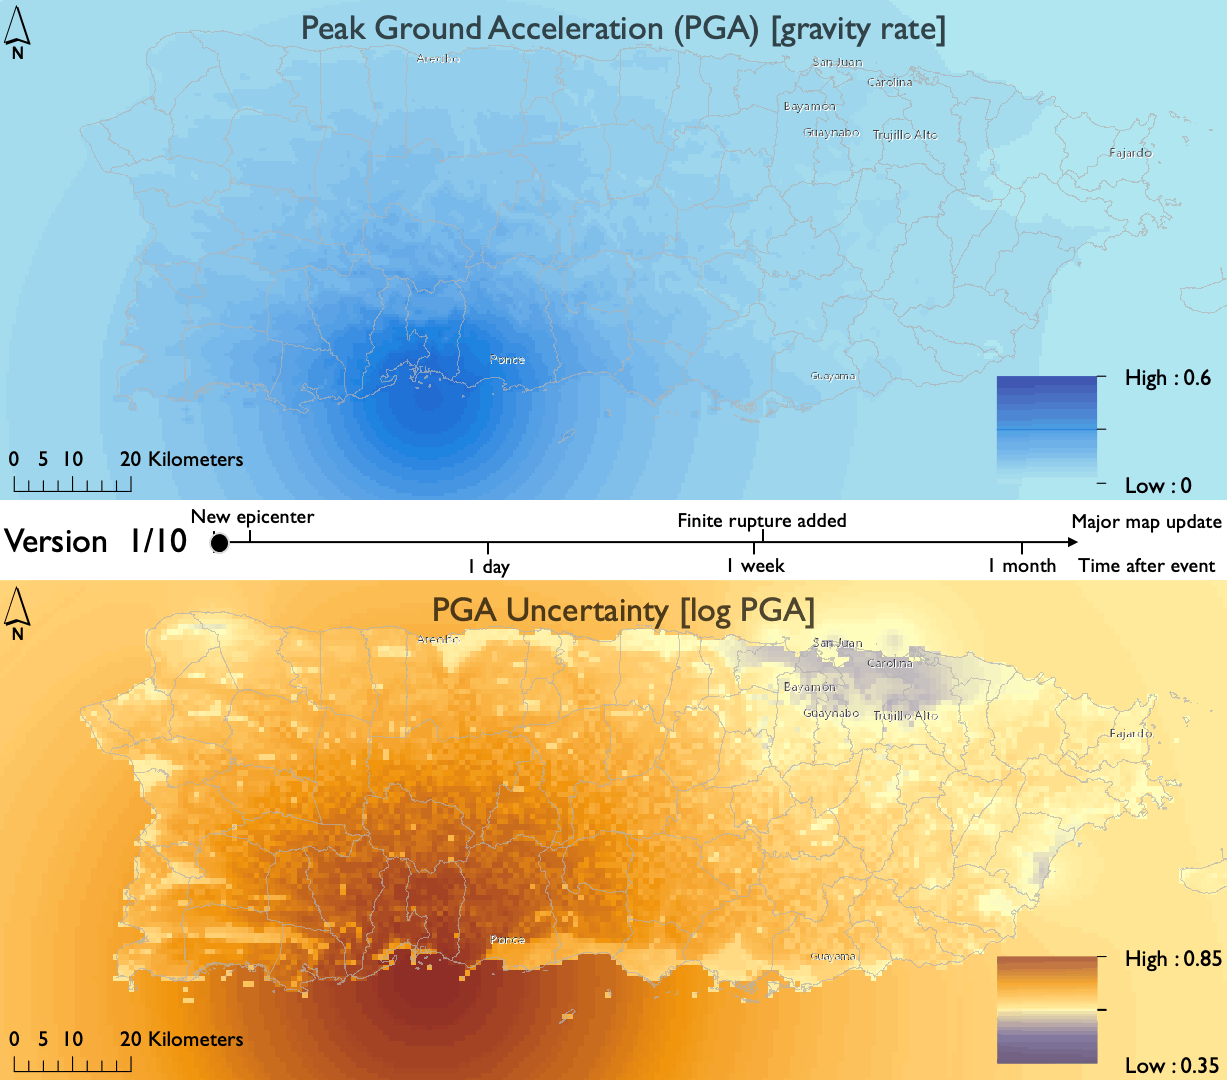
In 1927, a large magnitude Mw 6.3 earthquake originating on the Dead Sea Fault shook the Levant Region in the...
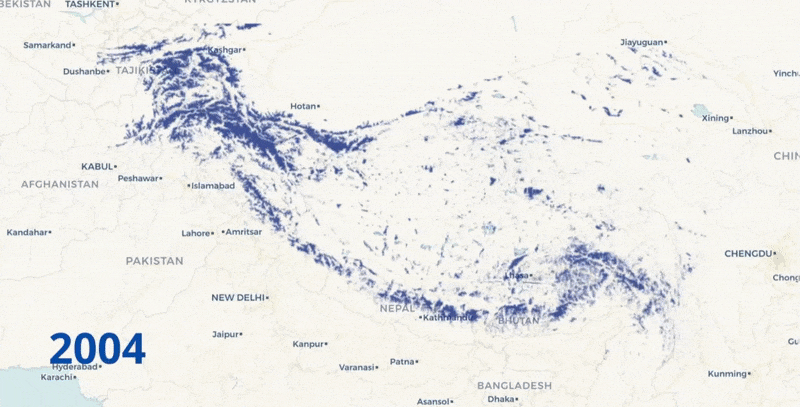
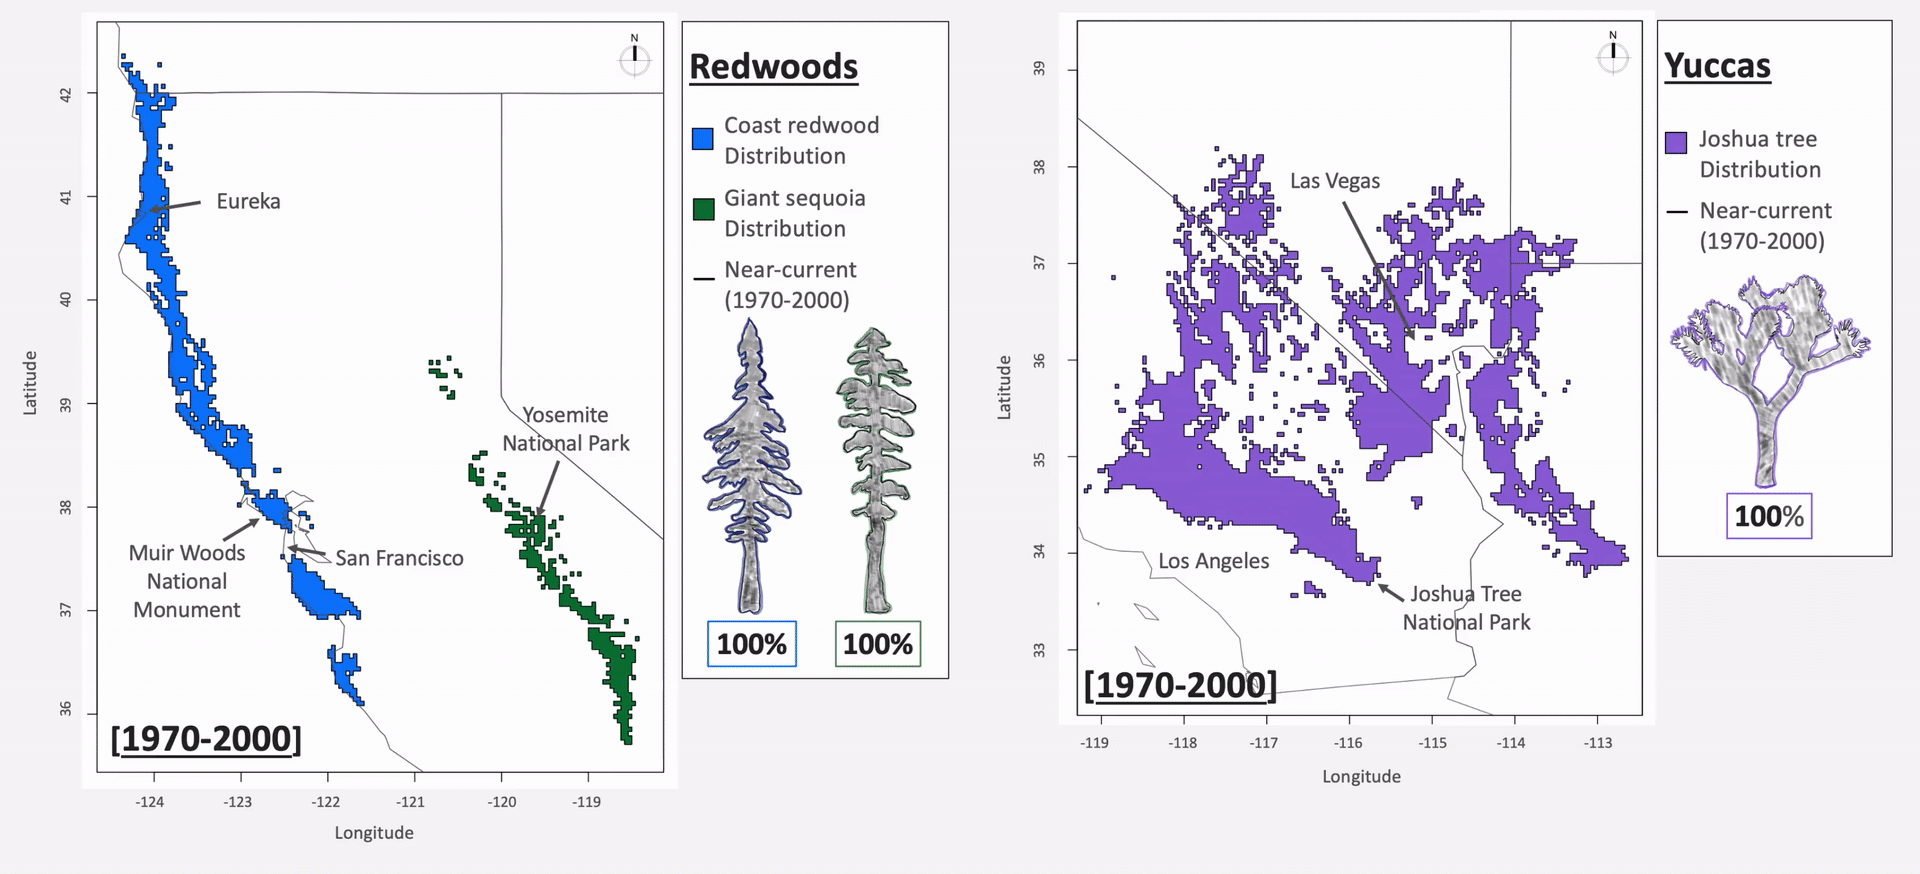
Himalayan Glacial Cover: 2004 vs 2018
This interactive slider visualisation compares summer Himalayan glacial cover in 2004 and 2018. Anecdotal photographs are often used to shed...
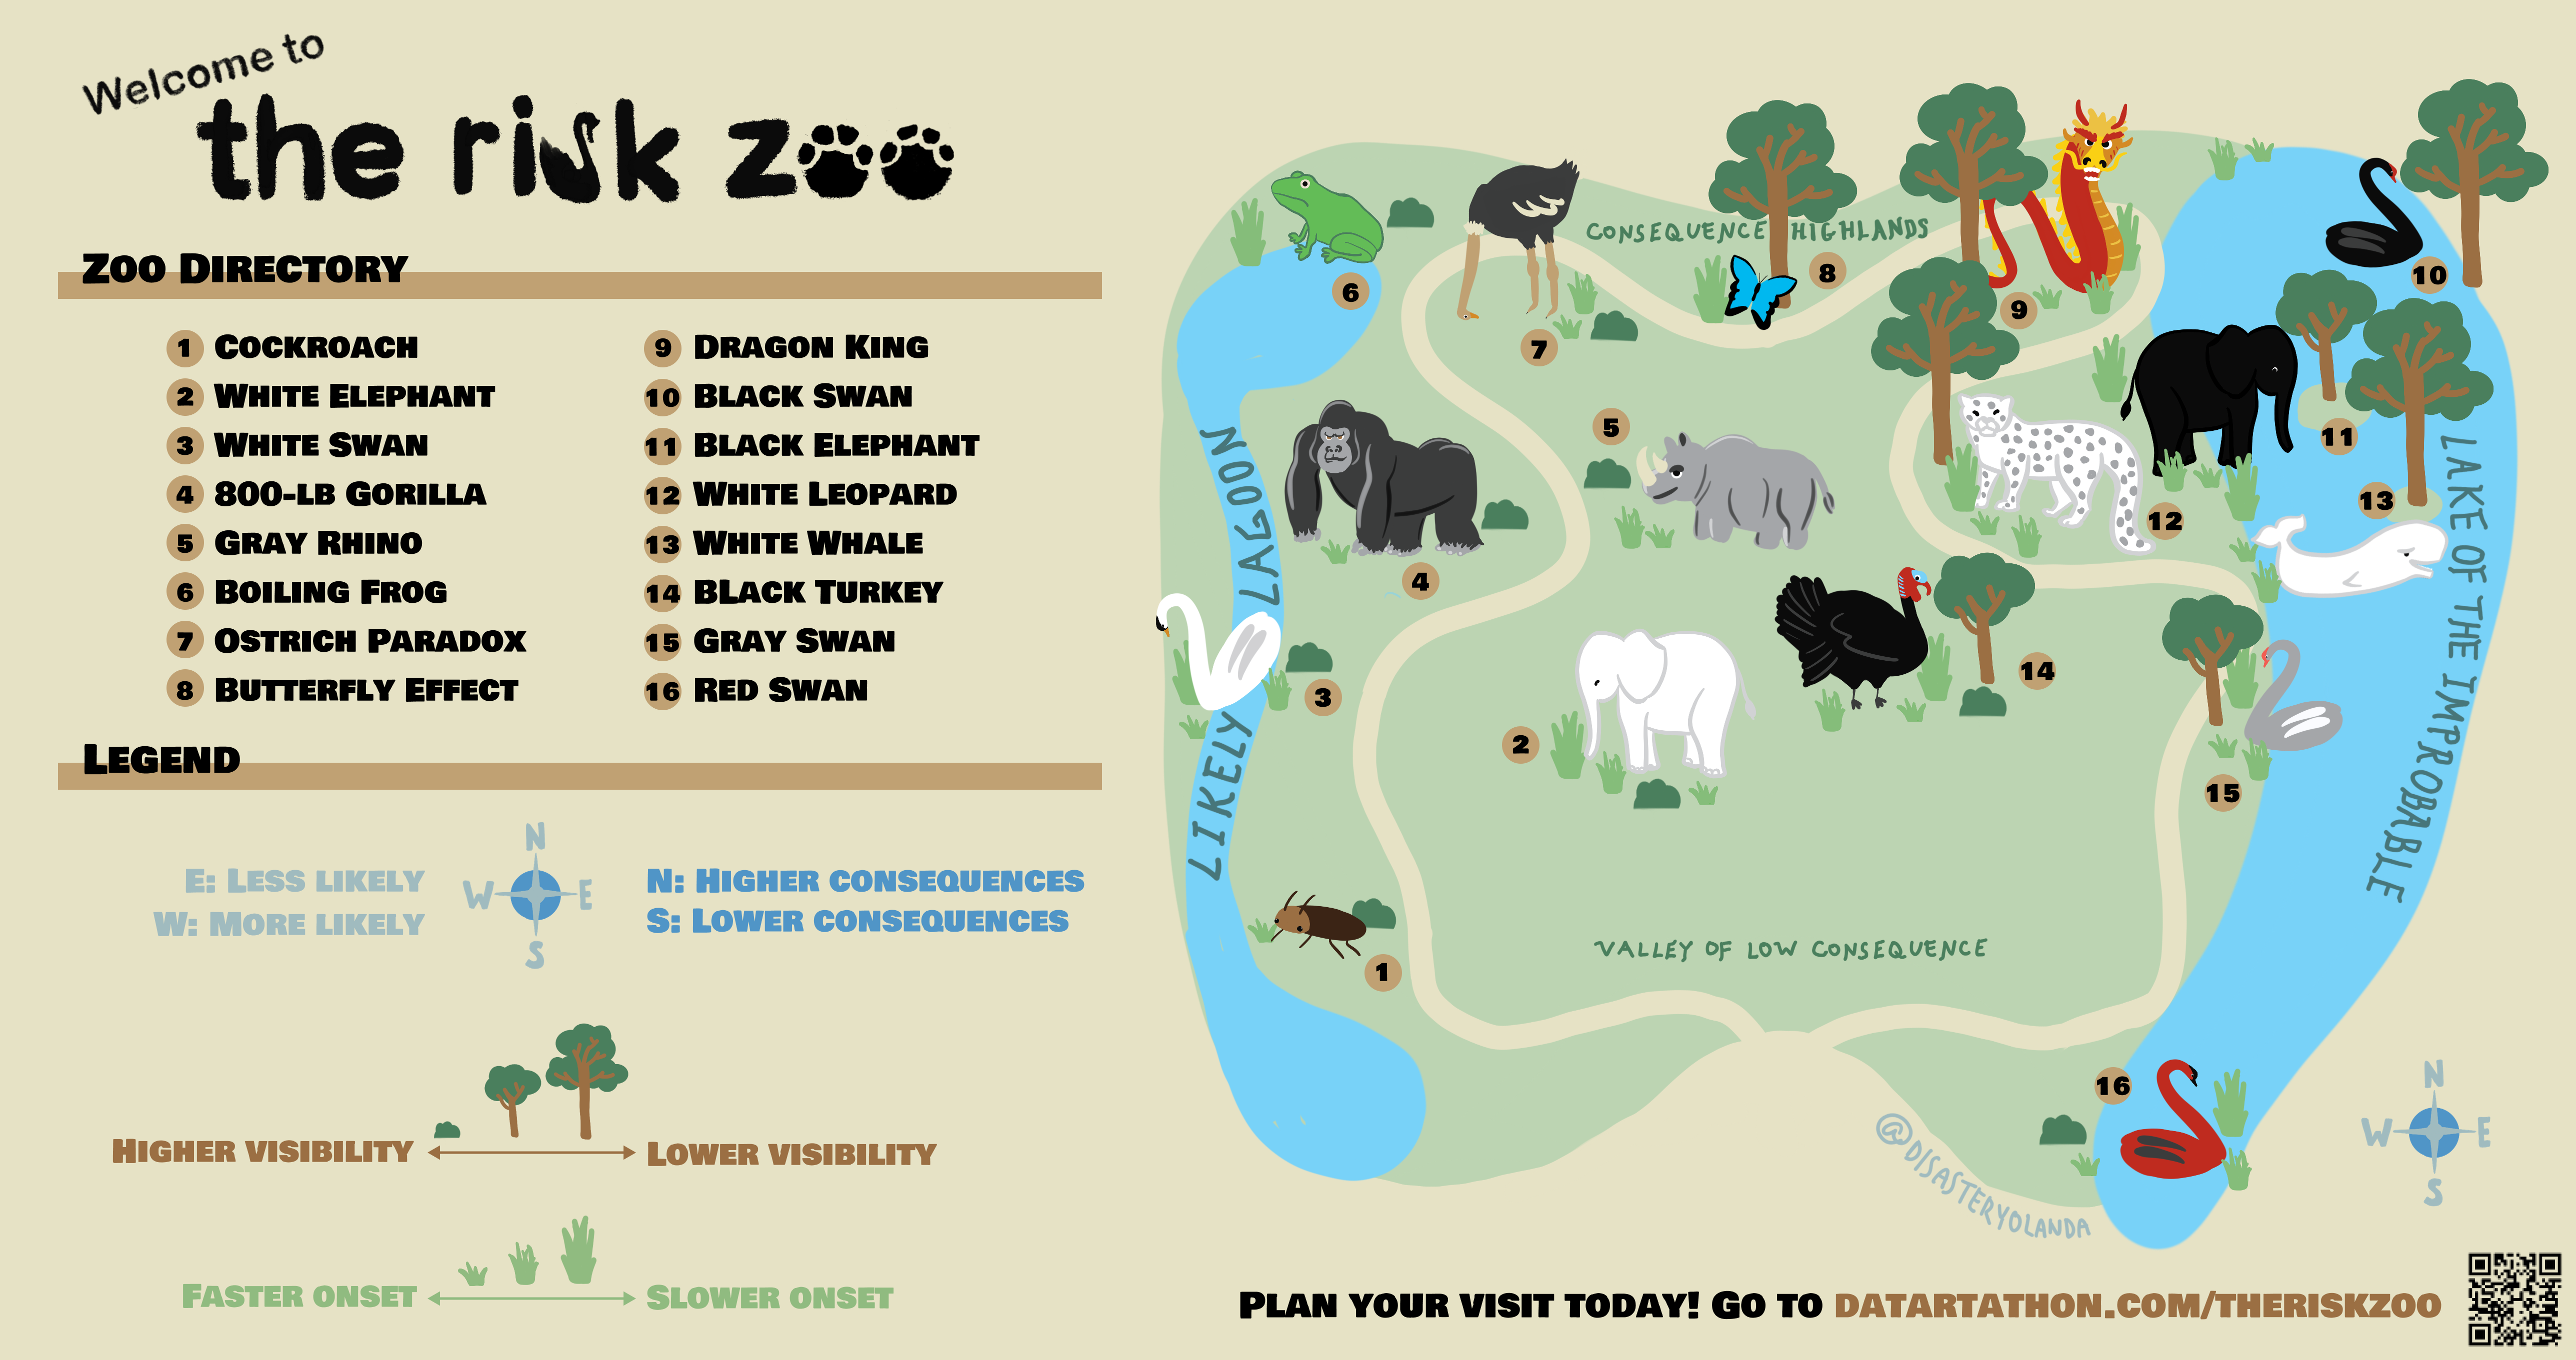
The Risk Zoo
Animal kingdom metaphors are often invoked in the disaster risk world for their accessibility and familiarity when discussing difficult or...
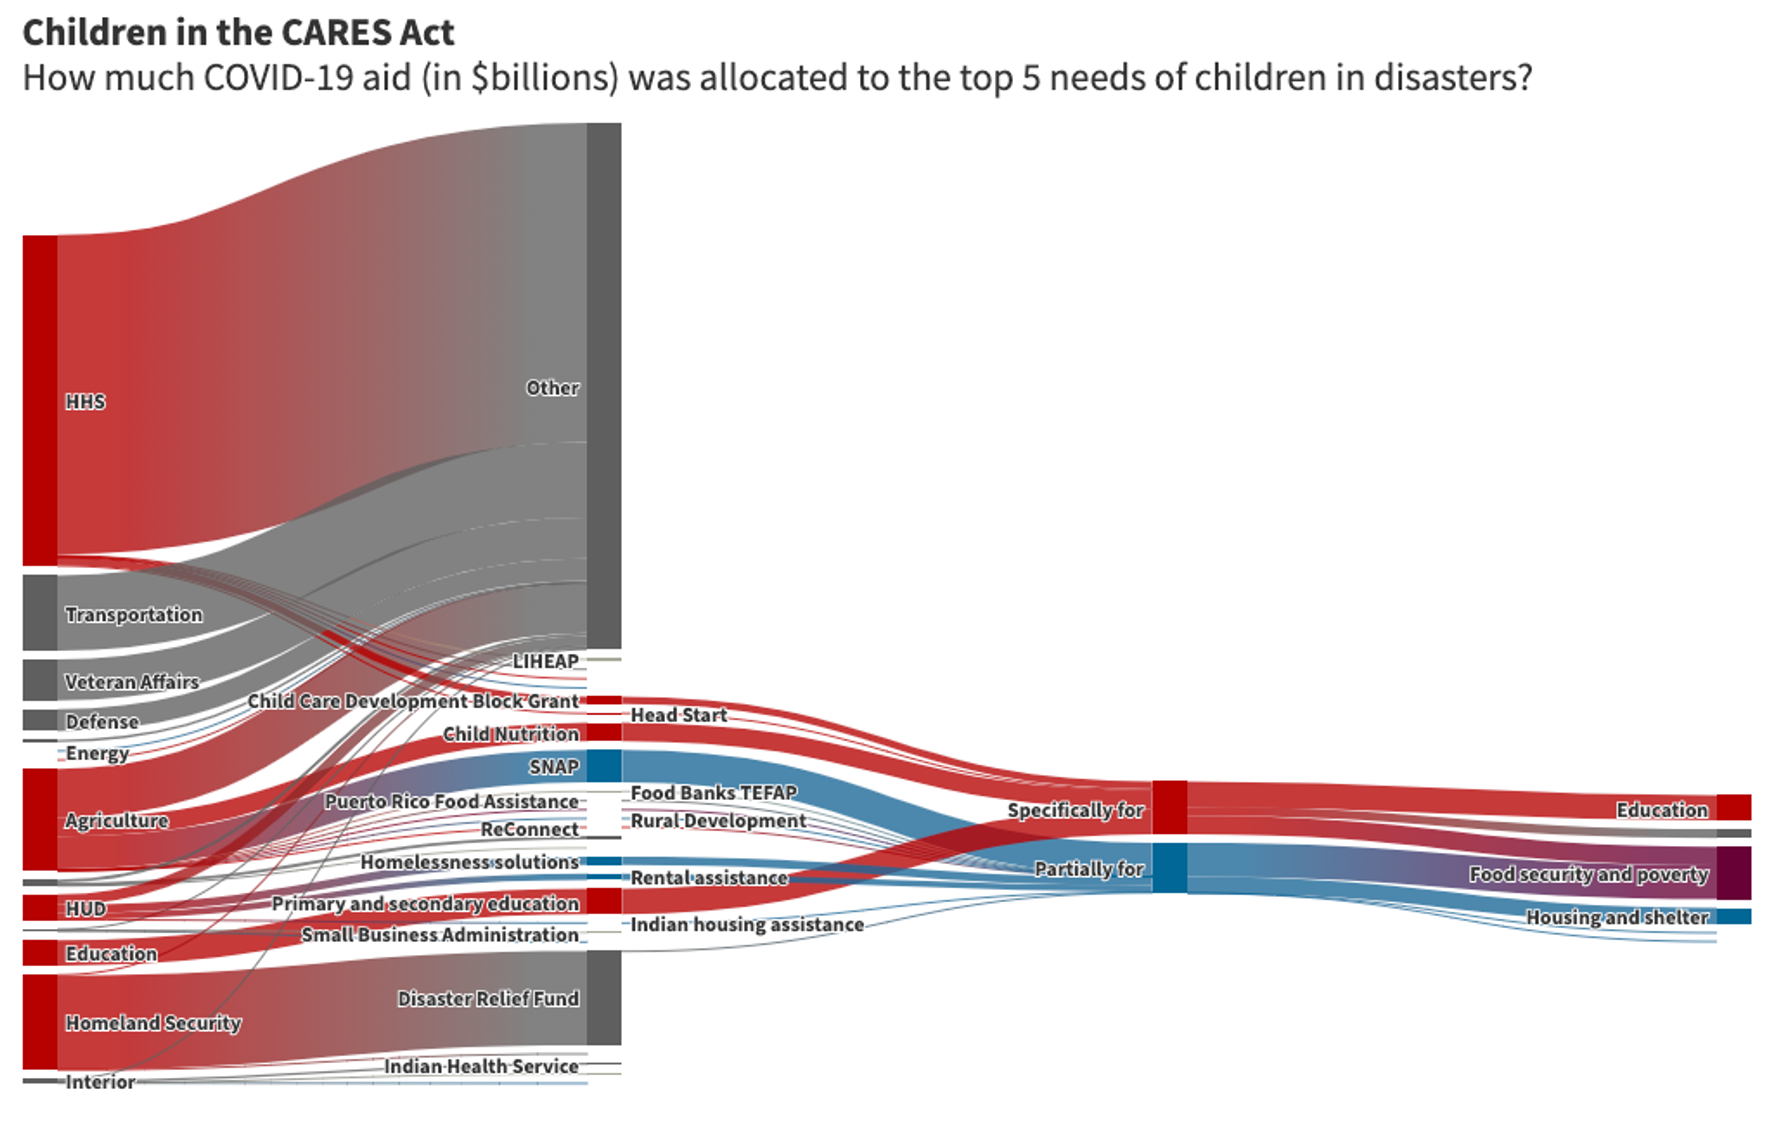
Children in the CARES Act
This project is intended to de-mystify the emergency appropriations process in America by following the initial appropriation amounts through their...